I have strong web service development skills, including creating interactive web apps using ESRI’s Experience Builder for geospatial applications. On the front-end, I am proficient in HTML, CSS, and JavaScript, ensuring visually appealing and responsive interfaces. For back-end development, I use PHP and PostgreSQL to manage databases and server-side processes efficiently. Additionally, I have experience working with WordPress, allowing me to build and customize content management systems. This combination of tools enables me to deliver fully functional, data-driven web applications.
Web Mapping Application for GEWA National Park
Problem
The web mapping application was created to provide an interactive tool for visualizing and managing geospatial data related to the George Washington Birthplace (GEWA) National Park. The goal was to integrate various spatial features, including fish sites, water bodies, vegetation types (both cultural and natural), buildings, and other small-scale park features, into a single web-based map. This project addressed the need for a comprehensive and accessible spatial tool to assist park staff, researchers, and visitors in understanding the park’s landscape and resources.
Analysis
To build the web mapping application, I used a combination of geospatial tools and technologies. The first step was to gather and process spatial data, including shapefiles and raster data representing the park’s features. Using ArcGIS Pro, I processed the data layers and created a pleasant symbology. I then published the layers to ArcGIS Online to host the map layers. Finally, I developed the interactive web map using ArcGIS Maps SDK for JavaScript, which enabled dynamic display and user interaction with the map. This approach allowed for seamless integration of the data layers, ensuring users could toggle between different basemaps and access information about the fish sites, buildings and small scale features.
Results
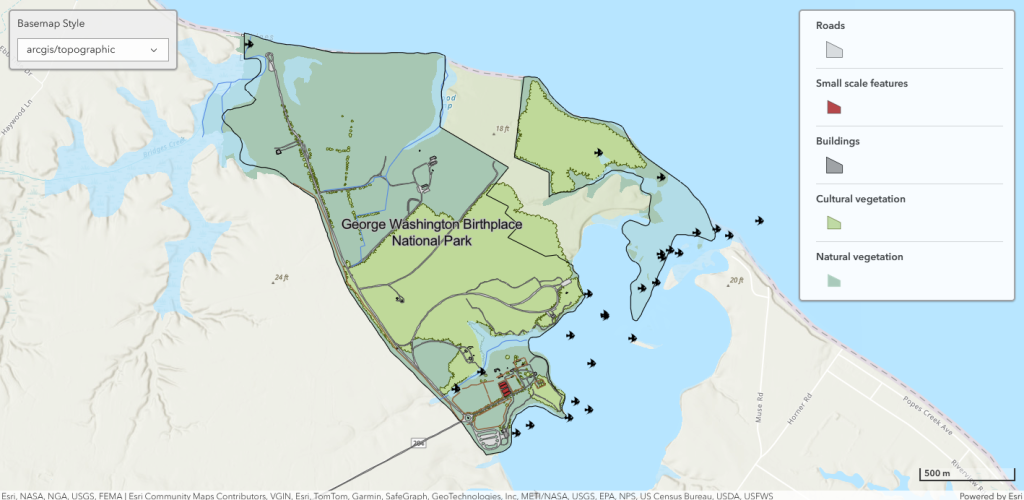
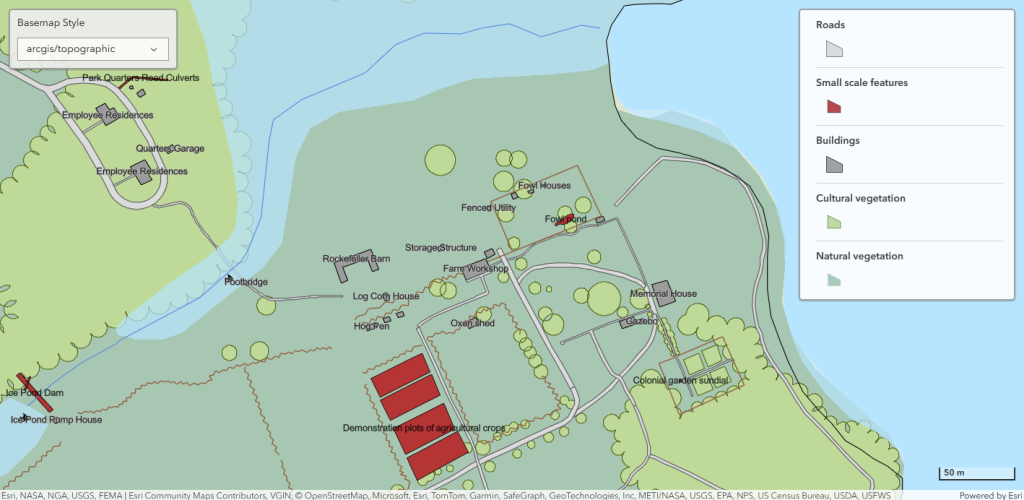
The completed web mapping application visually represents key features of the George Washington Birthplace National Park, including fish sites, water bodies, vegetation zones, and park structures. Users can easily navigate the map and select specific features for more information. The web map enhances the park’s data accessibility by allowing users to view cultural and natural resources interactively, promoting better resource management and decision-making. Figure 1 and 2 show screenshots of the web map at two different zoom levels.


Reflection
This project significantly enhanced my web GIS development skills, particularly in the use of ArcGIS Maps SDK for JavaScript to build interactive, web-based mapping solutions. I learned how to efficiently organize and publish geospatial data online and create user interfaces that balance functionality with simplicity. The experience highlighted the importance of integrating different data layers into a cohesive visualization tool that caters to a variety of users, from park staff to the general public.
Link to Web Map
https://vclvm178-6.vclgis.cnr.ncsu.edu/GEWAFishSites.html
—— x ——
Crowdsourcing Coral Reef Health: A Spatial Survey of Caribbean Marine Ecosystems
Problem
The health of coral reefs in the Caribbean is a critical environmental issue, as these ecosystems support marine biodiversity and coastal communities. However, systematic data on reef health is often scarce and costly to collect, limiting efforts to monitor and protect these ecosystems. This project aimed to address this problem by creating a crowdsourced data collection platform using Survey123. The survey targeted individuals who have swum, snorkeled, scuba-dived, or free-dived in the Caribbean, enabling them to report their observations of coral reef health, including species diversity, reef condition, and geographic location. The purpose was to gather valuable citizen science data to enhance understanding and conservation of Caribbean coral reefs.
Analysis
The project leveraged Esri’s Survey123 for ArcGIS to create an intuitive, user-friendly online survey. Key questions focused on capturing essential data, such as the type and timing of activities, observed coral species, perceived coral health, and any notable changes or impacts. Participants could mark the location of their observations on an interactive map and upload supporting photos, adding geographic and visual dimensions to the data.
Survey design included logical workflows to ensure participants could provide complete and accurate information easily. Interactive map integration allowed for precise geotagging of observations, enhancing the spatial accuracy of the collected data. The survey link was then distributed to the target audience, enabling data collection from diverse contributors who had firsthand experience with Caribbean coral reefs.
Results
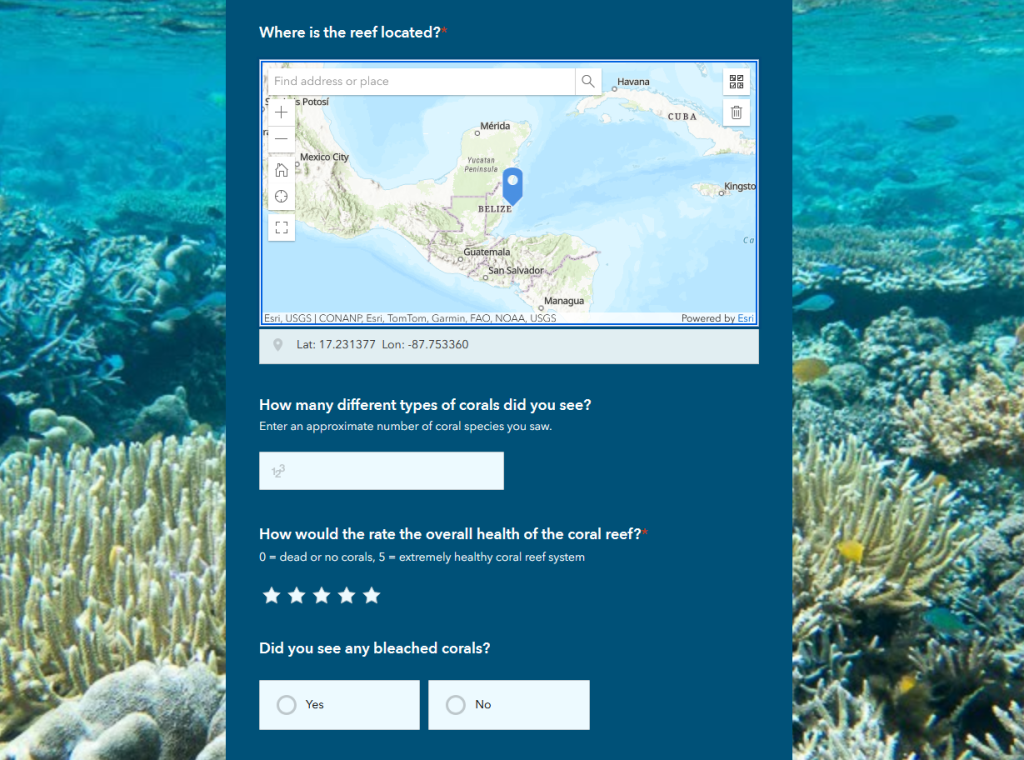
The survey provided a platform for collecting firsthand, location-specific data on Caribbean coral reef health from individuals with direct observational experience. Significant outcomes included an organized dataset with spatial and temporal information about reef conditions, species diversity, and health indicators. Visual outputs, such as maps created from participant-provided coordinates, illustrated the distribution of reported observations across the Caribbean. Uploaded photos provided additional context, offering visual evidence to support the data. The survey demonstrated the potential of citizen science as a scalable, cost-effective method for gathering environmental data in under-monitored regions. Figure 3 shows a screenshot of some questions asked in the survey.

Reflection
This project allowed me to apply my survey design skills to address an important environmental issue. Using Survey123, I learned to design and implement an interactive, spatially enabled survey that balanced simplicity for participants with robust data collection capabilities. I also gained insight into the potential and limitations of crowdsourced data, particularly in terms of accuracy, consistency, and outreach.