I have a diverse and robust programming skill set, with proficiency in Python, C++, and Java, which allows me to tackle a wide range of software development projects. My expertise extends to web development, where I am skilled in HTML, CSS, and JavaScript, enabling me to create dynamic and responsive web applications. Additionally, I have a strong background in working with relational databases and SQL, which is essential for managing and querying large datasets.
Mapping Spotted Lanternfly Sightings
Problem

Spotted Lanternfly (SLF) is an invasive plant-hopper that feeds on a wide range of plants, including grapes, hops, stone fruits, and hardwood trees. If not contained, SLFs could severely impact the grape, orchard, and logging industries in the U.S. People who are aware of the damages that can be caused by SLFs often post their encounter with the insect on social media. A program that can collect information about SLF sightings from social media posts could be useful for collecting data and modeling how SLFs are spreading across the U.S.
Analysis
I developed a Python program that reads a spreadsheet containing twitter posts mentioning SLF, identifies posts that are about direct sightings of SLF, extracts locations of the sightings, and creates maps showing the number of such posts in each state of the continental U.S.
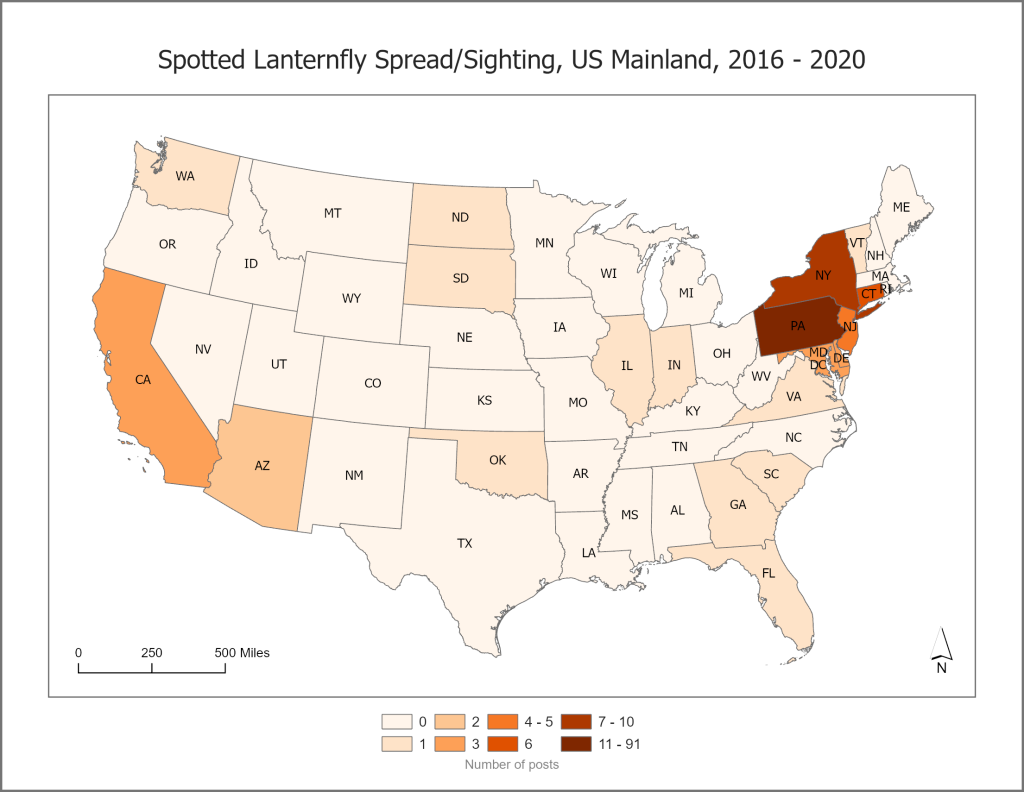
The classification method I used for identifying SLF sighting/spread related posts was very simple. If certain words are present in a post, it gets classified as direct sighting or spread type post. So incorrect classifications can occur. This is obvious from the map in Fig. 2 because SLFs have not reached California yet. I was unable to train a machine learning model to perform the classification due to the lack of training data and time. If more training data becomes available, this tool can be improved by implementing a more intelligent classification system.
The program was written in Python and uses spaCy, a free open-source library for Natural Language Processing in Python, and ArcPy, a package for performing geographic data analysis and map automation.
Results
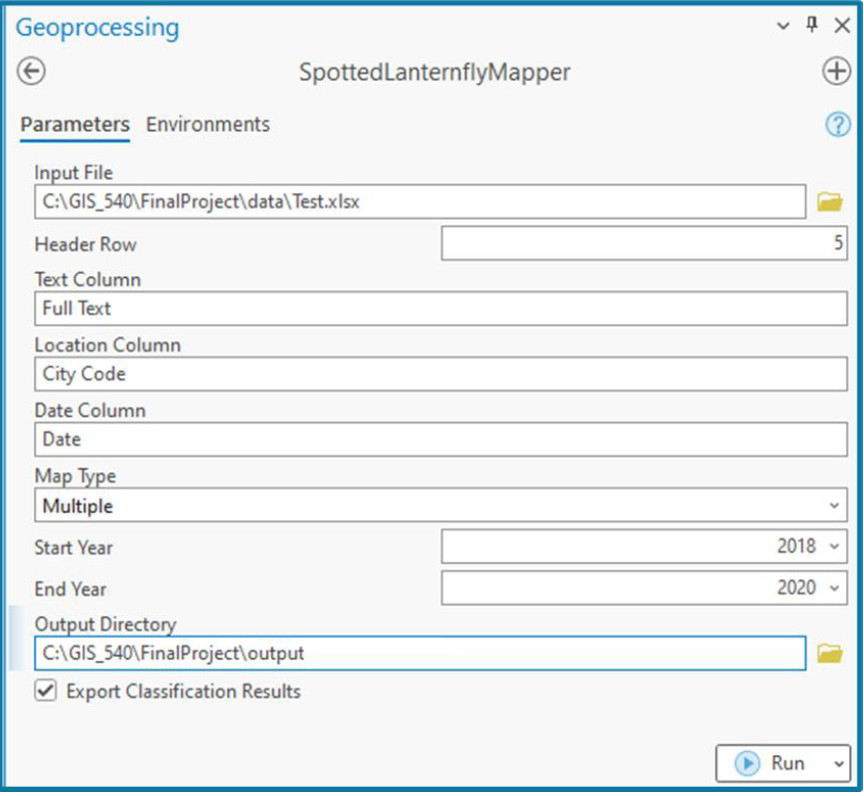
Following is a screenshot of the ArcGIS Pro script tool showing various input parameters and options to customize the output.

The script can generate multiple maps, one for each year, or a single map of all the years combined. Below is a map showing the number of posts about SLF sightings in the US mainland from the year 2016 to 2020 (Fig. 3).

Reflection
I have created an ArcGIS Pro script tool that can collect important information about SLF sightings from social media posts and create maps that show the number direct sightings of SLF across the continental U.S. Working on this project enhanced my Python programming skills and I have gained valuable experience in using ArcPy and spaCy. ArcPy is a powerful library for spatial analysis, data management, and conversion. Experience in natural language processing using spaCy can be extremely useful in future projects.
Code
https://github.com/haved-jossain/spotted-lanternfly-mapper
————————————————————————————————————-
Land Cover Classification of Rangamati, Bangladesh
Problem

The project addressed the need for accurate land cover classification in Rangamati, Bangladesh, a region characterized by diverse landscapes. Understanding land cover distribution is essential for informed decision-making in environmental management, urban planning, and conservation. This project aimed to create a detailed map and analysis of land cover types—water, urban areas, vegetation, and bare earth—using Sentinel-2 multispectral imagery and advanced classification techniques. The primary purpose was to provide an updated and accurate representation of land use in the region.
Analysis
To perform the classification, Sentinel-2 imagery captured in March 2024 was imported into Google Earth Engine, where a median filter was applied to generate cloud-free composite images. A training dataset was developed with 50 georeferenced points for each land cover type: water, urban areas, vegetation, and bare earth. These points were used to train a Classification and Regression Trees (CART) model, a supervised classification algorithm that identifies land cover types based on spectral signatures. The classification was performed programmatically using JavaScript and the Google Earth Engine API, ensuring precise and reproducible results. The final outputs included a classified map and a statistical breakdown of the area covered by each land cover type.
Results
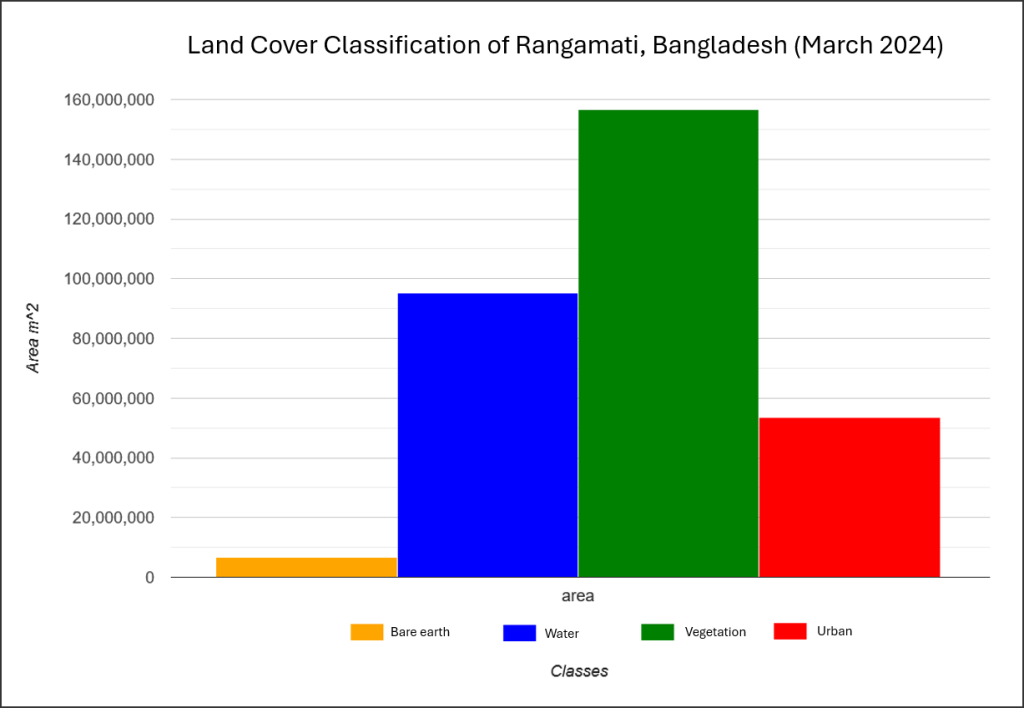
The project produced a detailed land cover map for Rangamati, clearly delineating areas of water, urban development, vegetation, and bare earth. A corresponding chart quantified the total area occupied by each land cover category, providing actionable insights for stakeholders. The results highlighted the spatial distribution and extent of different land cover types, enabling better understanding of land use dynamics in Rangamati. The integration of visual and quantitative outputs made the analysis accessible to both technical and non-technical audiences.


Reflection
This project enhanced my skills in remote sensing, geospatial analysis, and programming in Google Earth Engine. Training and applying the CART model deepened my understanding of supervised classification techniques and their application to real-world problems. Working with Sentinel-2 imagery and Google Earth Engine improved my ability to handle large datasets and automate geospatial workflows.