I have strong expertise in geospatial modeling and analysis, with a solid foundation in using GIS tools like ArcGIS Pro for advanced spatial analysis and visualization. My skills include performing spatial interpolation, terrain modeling, map algebra, cost surface analysis, and least-cost path analysis. I am proficient in flow routing, watershed analysis, viewshed analysis, and solar energy potential assessments. Through these capabilities, I support informed decision-making in diverse, data-driven projects.
Least-Cost Path Analysis for the Perseverance Rover in Mars
Problem

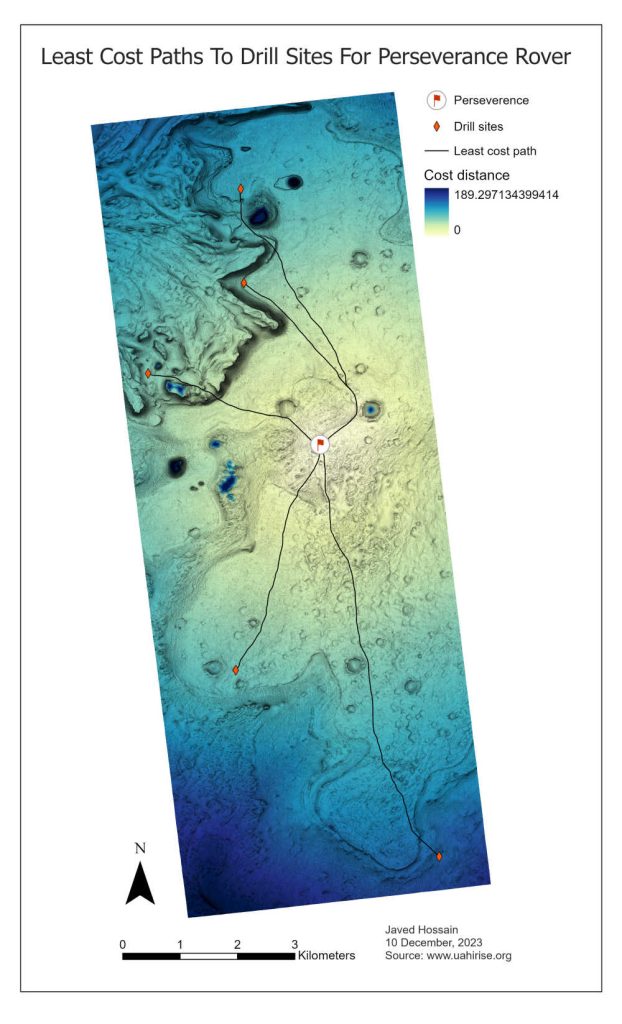
The goal of this project was to identify safe and optimal paths for the Perseverance Rover to travel to potential new drill sites in the Jezero Crater on Mars. The key challenge was to avoid hazardous surface features such as steep slopes, sand, depressions, and peaks that could impede the rover’s movement or damage its equipment. The purpose of the project was to compute a cost surface analysis and identify the least-cost paths to these drill sites, which would maximize safety and efficiency in navigating the Martian terrain.
Analysis
To solve the problem, a series of geospatial analysis techniques were used. First, flowlines, depressions, and peaks were identified by processing a digital terrain model (DTM). Manual delineation was employed to map sandy regions. A speed raster was created to simulate the rover’s travel speed under different conditions (e.g., slope, sand, depressions). The speed raster was then converted into a cost surface, with the lowest speeds representing areas the rover should avoid. Finally, least-cost paths were computed from the rover’s landing site to each of the identified drill sites. This approach ensured that the rover could safely navigate the challenging terrain while minimizing travel time.
Results
The results of the project were visualized in several key maps. Flowlines, peaks, and depressions were mapped to show areas of potential difficulty. A speed raster was created, showing maximum rover speeds based on terrain features, with areas that should be avoided highlighted in dark red. The final cost surface map displayed travel costs to the five selected drill sites, with least-cost paths clearly avoiding hazardous areas. The project successfully identified the safest and most efficient routes for the rover to explore (Fig. 2).

Reflection
This project significantly enhanced my geospatial modeling and analysis skills, particularly in terrain analysis and least-cost path modeling. I learned how to apply advanced GIS techniques, such as flowline and peak identification, to real-world challenges in planetary exploration. This experience also strengthened my ability to use ArcGIS for complex geoprocessing and cost surface analysis. The project emphasized the importance of optimizing safety and efficiency in remote exploration missions. What I learned from this project—efficient pathfinding and hazard avoidance—can be applied to various fields beyond planetary exploration, such as environmental studies, urban planning, and disaster management.
ArcGIS Pro Project Files
The project report can be accessed from: https://javed-hossain.com/wp-content/uploads/2024/10/GIS582Report.pdf
Requires ArcGIS Pro 3.2.2 or higher to run the project. Project files can be downloaded from https://drive.google.com/drive/folders/1CPdkrdZzpGKNRBjvJriCbgo5ms4hqMeb?usp=sharing.
—— x ——
Habitat Suitability Analysis for Green Salamanders
Problem

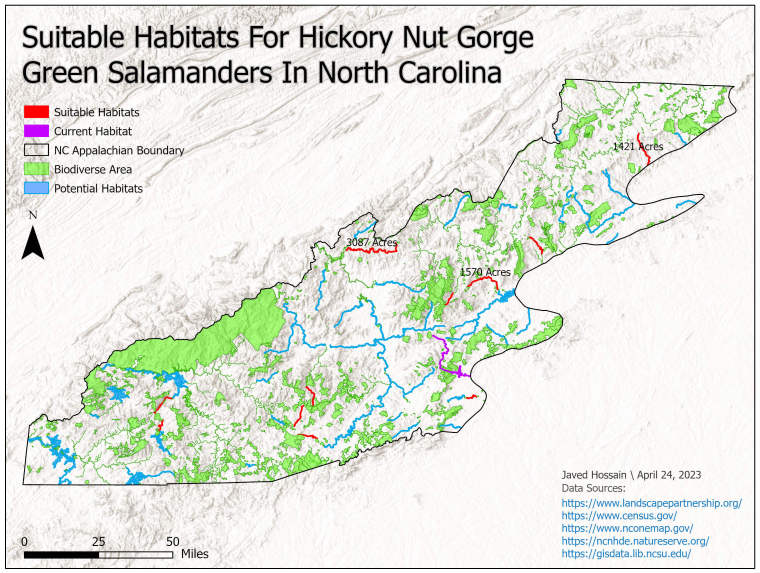
The problem addressed in this project was to identify suitable habitats within North Carolina where the critically endangered Hickory Nut Gorge green salamanders could repopulate and thrive. The salamanders’ current habitat is under threat from climate change, pollution, and human development. To support their conservation, the project aimed to map potential habitats that provide the necessary environmental conditions such as proximity to streams, sufficient forest cover, and minimal human disturbance. The goal was to create a comprehensive map highlighting areas that meet the criteria for the salamanders’ survival and repopulation efforts.
Analysis
The project employed a combination of geospatial analysis techniques to identify suitable habitats. The process began by defining the boundary of the Appalachian Mountains within North Carolina. Then, streams and creeks were buffered by 500 feet to account for the salamanders’ need for water sources. The land cover data was processed to classify forest types and exclude unsuitable areas like developed land, farmland, and barren regions. The final analysis used zonal statistics to calculate habitat suitability scores based on land cover, and only habitats scoring above a 70% suitability threshold were considered for repopulation. Throughout the process, data was clipped, buffered, and analyzed using tools within ArcGIS Pro to ensure that the results aligned with the salamanders’ environmental needs.
Results
The significant outcome of the project was a detailed web map displaying potential habitats for the green salamanders in the Appalachian Mountains of North Carolina. The map shows the suitable habitats alongside the salamanders’ current habitat, providing a visual comparison. The final result identified the three largest suitable habitats, each larger than 500 acres, with areas of 3,087, 1,570, and 1,421 acres, respectively. These habitats offer the optimal environmental conditions needed for the salamanders’ survival and repopulation, and they are highlighted in the project’s map layout (Fig. 4).

Reflection
This project has improved my geospatial analysis skills, particularly in working with environmental data to support species conservation efforts. Through this work, I developed a deeper understanding of using GIS tools to model and assess habitats, combining data from multiple sources to produce actionable insights for wildlife conservation. The project not only taught me how to apply spatial analysis techniques but also helped me appreciate the importance of data accuracy and thoughtful analysis in identifying conservation opportunities.
Web Map
https://ncsu.maps.arcgis.com/apps/mapviewer/index.html?webmap=7dda672371474cddbfbdd9b7e4e1f451